

Data Visualization Courses


- AIA CES
- AICP CM
- CNU-A
- SACPLAN CPD


- AIA CES
- AICP CM
- CNU-A
- SACPLAN CPD

- CIP
- AIA CES
- AICP CM
- SACPLAN CPD


- AIA CES
- AICP CM
- CNU-A
- SACPLAN CPD


- AICP CM
- CNU-A
- SACPLAN CPD


- CIP
- AIA CES
- AICP CM

- AICP CM
- CNU-A
- SACPLAN CPD







- AIA CES
- AICP CM


Top Data Visualization Instructors




















Master Urban Planning Skills With A Planetizen Courses Subscription.
Sign up
High quality video lessons developed by experts.

Complete course work to receive a certificate from Planetizen.

Test your comprehension with course quizzes.

Access reading lists, articles, and other materials prepared by instructors.
All Data Visualization Courses
21st Century Storytelling: Video for Planners
This course will give you motivation to create video content, and give you practical, affordable tips to be heard among the online noise.


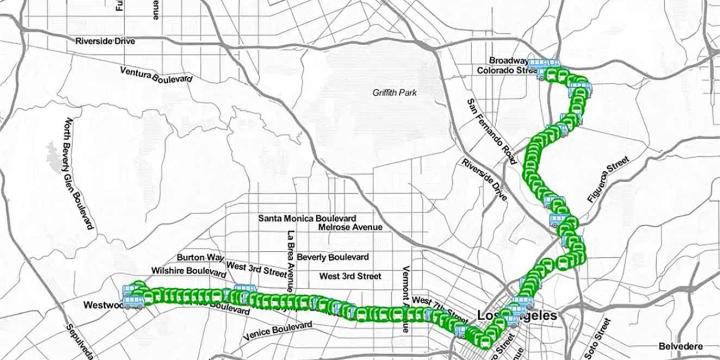
Building a Transit Map Web App
This course examines the entire process of building an interactive, web-based mapping application.
Blogging About Planning
In this course we will review how blogs are used as planning tools to educate and engage participants in community decisions.
Planning and Promoting Your Community Engagement Process
This course provides you with a step-by-step process for designing an effective public engagement process.