

Data Visualization Courses


- AICP CM
- CNU-A
- SACPLAN CPD


- CIP
- AIA CES
- AICP CM

- AICP CM
- CNU-A
- SACPLAN CPD







- AIA CES
- AICP CM






Top Data Visualization Instructors




















Master Urban Planning Skills With A Planetizen Courses Subscription.
Sign up
High quality video lessons developed by experts.

Complete course work to receive a certificate from Planetizen.

Test your comprehension with course quizzes.

Access reading lists, articles, and other materials prepared by instructors.
All Data Visualization Courses
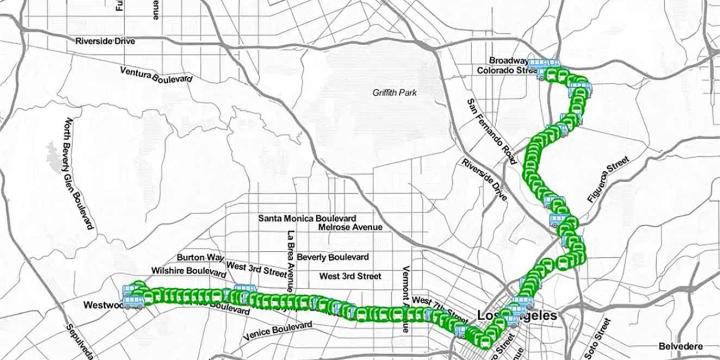
Building a Transit Map Web App
This course examines the entire process of building an interactive, web-based mapping application.


Introduction to WebGIS
This course explains various Internet technologies commonly used to build web-based visualization applications with municipal data.