

Data Visualization Courses


- AIA CES
- AICP CM
- CNU-A
- SACPLAN CPD


- AIA CES
- AICP CM
- CNU-A
- SACPLAN CPD

- CIP
- AIA CES
- AICP CM
- SACPLAN CPD


- AIA CES
- AICP CM
- CNU-A
- SACPLAN CPD


- AICP CM
- CNU-A
- SACPLAN CPD


- CIP
- AIA CES
- AICP CM

- AICP CM
- CNU-A
- SACPLAN CPD







- AIA CES
- AICP CM


Top Data Visualization Instructors




















Master Urban Planning Skills With A Planetizen Courses Subscription.
Sign up
High quality video lessons developed by experts.

Complete course work to receive a certificate from Planetizen.

Test your comprehension with course quizzes.

Access reading lists, articles, and other materials prepared by instructors.
All Data Visualization Courses
ArcGIS Pro Fundamentals and Beginner Analysis
New
This course introduces essential spatial analysis and data management techniques in ArcGIS Pro. You'll learn how to perform spatial queries and selections, symbolize and label data effectively, and utilize data editing and geoprocessing tools.


Introduction to the UrbanSim Cloud Platform
At the end of this course, participants will be acquainted with the UrbanSim forecasting methodology, understanding the features available in the UrbanSim Cloud Platform and the basics of an UrbanSim model at the Census block level.
Transit Service Design 101
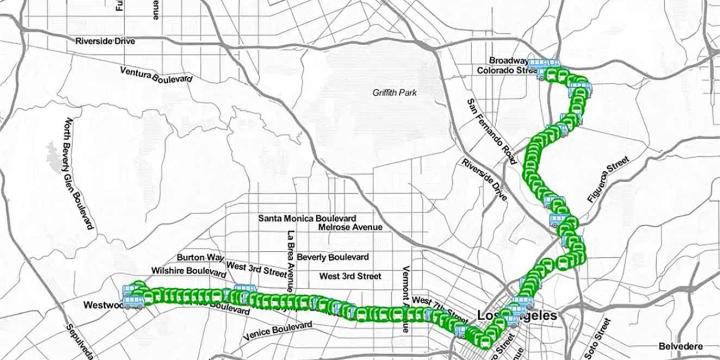
In this course, we will review the principles of transit service design, how resources are allocated and accounted for, and using the Remix software platform, we will design and evaluate a new transit route.