Course Info
9 video lessons (56 Mins)
Published
2019-
4.18
Preview Course
Browse Course Chapters
-
1.Introduction
1 min
-
2.Diversity and Segregation
5 mins
-
3.Measurement Approaches
5 mins
-
4.Retrieving Data
6 mins
-
5.Working with Tables and GIS
9 mins
-
6.Calculating the Measures
8 mins
-
7.Combining Data
5 mins
-
8.Using GeoDa Software
6 mins
-
9.Merging Tables and Wrap-Up
7 mins
What You Will Learn
- Understand segregation and diversity
- Alternative ways of measuring neighborhood segregation and diversity
- The pros and cons of alternative measurement approaches
- How to work with Census data to measure neighborhood segregation and diversity.
Course Description
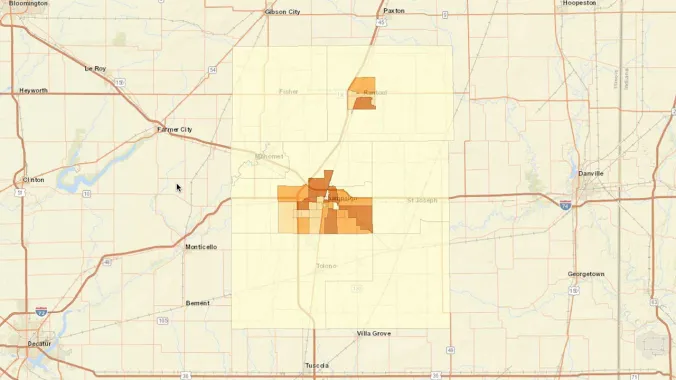
The difficulties in measuring social differences at the local level—at the scale of a neighborhood—is one of the most significant challenges facing U.S. cities. Overcoming that challenge is of key interest to city planners. This course reviews various ways to measure both segregation and diversity at the neighborhood scale. The course works through an example using data for Chicago, showing how simple spreadsheet calculations can be used to map the locations of both neighborhood segregation and diversity.
Learn these skills
- Census
- Data Analysis
- Demographics
- Equity
- GIS
- Mapping
- Research Methods
AICP CM
This course is approved for 1 AICP CM credit.
AIA CES
This is 1 LU.CNU-A
This course is approved for 1 CNU-A credit.


